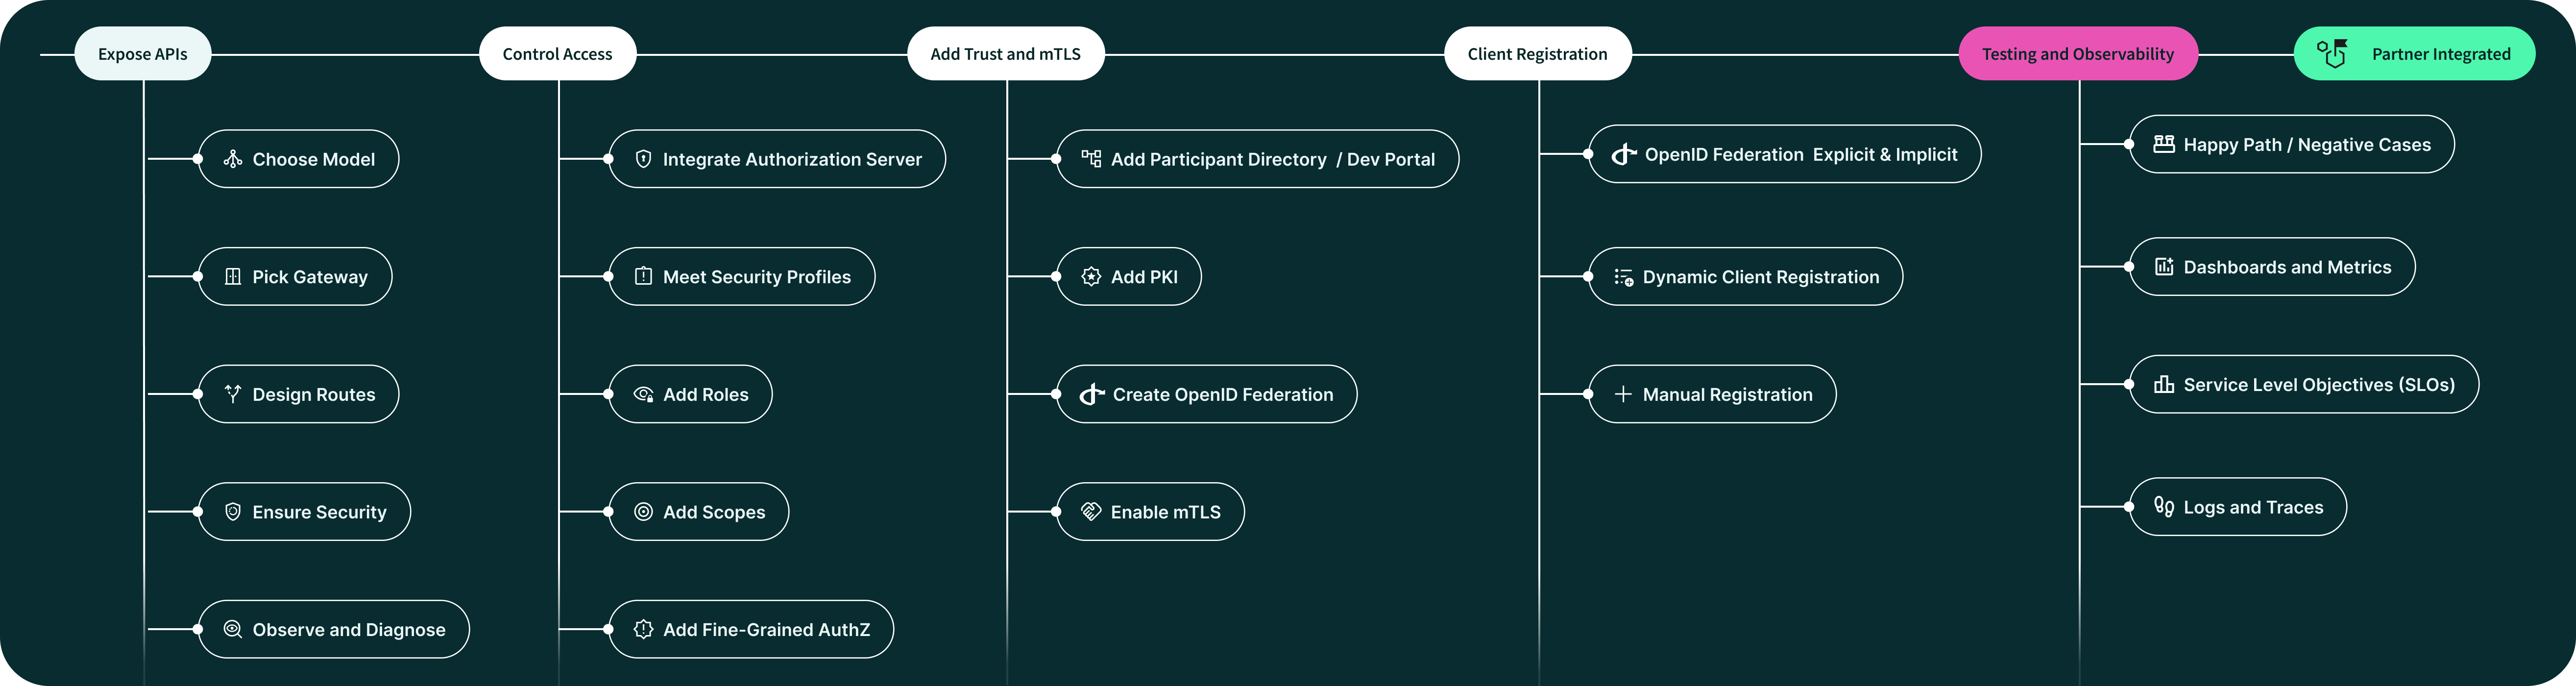
How to Test and Monitor Your APIs Before Partner Onboarding
You’ve locked down exposing your APIs, access control, trust & mTLS, and client registration–but the work isn’t finished until you can test your setup end-to-end and observe it in real time once partners start using it. Without these layers, the first integration will stall on avoidable errors or leave you blind to failures.
Testing APIs Before Partner Onboarding: Prove the Flow Works
Before opening the gates to a partner, validate the entire journey of a client application against your APIs. This should cover both “happy path” and negative cases.
Happy-path tests
Go beyond functional paths with data-driven assertions and protocol/standard conformance. For registration, validate not just the API call, but compare the resulting persisted client metadata in the authorization server against required RFCs and federation policies. Incorporate OpenAPI/Swagger contract validation to ensure your payloads and responses conform to advertised API schemas, especially for newly onboarded partners. Automate “witness testing” and conformance checks if your APIs are subject to regulatory or interoperability mandates.
For token issuance, validate claims content (audience, issuer, expiration,
scopes) using automated JWT parsing and signature checks. Simulate token refresh
and rotation not only with success paths but by asserting exact claim changes
after key or certificate rotation, and compare with authorization server logs
for matching trace IDs. Use sandboxed environments with organization-specific
configurations to ensure onboarding logic dynamically links clients to correct
org_id contexts.
For API calls, extend test scenarios with boundary value analysis—such as
testing the maximum and minimum accepted payload sizes, allowed query
parameters, and combinations of roles and scopes. If APIs support pagination,
bulk-upload, or streaming, include those user journeys. Validate TLS
version/cipher negotiation during API calls for real-world client compatibility.
Assert that each flow generates correct traces and structured logs (including
org_id, partner_id, client_id, and correlation IDs), and cross-link to
monitoring dashboards for validation.
Identity API lifecycle actions by integrating simulated client key/certificate expiry and rotation paths in CI. After rotating a key, force a re-auth attempt and assert the old tokens and key material are consistently invalidated throughout the gateway, authorization server, and backend. Trigger de-registration flows and validate not only client blocking but the audit log content, all the way to real-time observability dashboards.
Negative tests
Make negative tests more rigorous by automating edge-case and boundary testing.
Attempt registration with oversized bodies, malformed JSON/XML, or unexpected
content types (e.g., image uploads to a JSON endpoint) to verify handlers and
error responses. Assert precise validation of input (empty/extra fields, invalid
encoding, illegal characters in client_id or redirect URIs). For security,
run automated scans against endpoints for common vulnerabilities (SQLi, XSS,
improper error disclosure), and assert robustness against OWASP top 10 API
risks.
Test payload tampering by sending requests with missing required signing headers
or altered JWT signatures, and validate that cryptographically invalid or
unauthenticated requests are blocked. Challenge role separation—attempt actions
with tokens belonging to unrelated org_id or client_id and ensure proper
enforcement with not just error codes, but correct audit and monitoring traces.
For transport security, simulate protocol downgrade, weak ciphers, or expired CA certs. In mTLS scenarios, rotate both server and client certificates, deliberately introduce key mismatches, and ensure the gateway blocks and audits every attempt. Check rate-limiting with both burst and sustained attack patterns; ensure the quota logic resets correctly and long-term throttling is logged and reflected in observability.
Inject synthetic load and error scenarios (failover between services, delayed backend response, database downtime) during onboarding, then test that dashboard alerts and SLO budgets reflect real production signals. Test log and trace propagation for every failure path, and validate that privacy-sensitive error data is scrubbed or obfuscated as required by compliance.
Additional Considerations
-
Automate both categories in your CI/CD pipeline, instrument telemetry for every test, and validate test coverage against onboarding, registration, and security policies.
-
Document and version test cases, with corresponding expected structured log formats, traces, and error payloads.
-
Include witness and conformance testing phases where external reviewers/auditors can validate critical flows before production onboarding.
-
Integrate test management tools and test reporting back into partner-facing dashboards when preparing for external onboarding.
These practices deliver confidence not only in happy flows but in resilience to the innumerable real-world errors, providing robust observability and compliance from the first onboarding through every update.
Observability for APIs: See What’s Happening
Testing gives confidence, but observability ensures your onboarding doesn’t break silently in production. As soon as you prepare your API for its first partner, treat metrics, logs, and traces as first-class citizens, tightly integrated across your gateway, authorization server, and backend layers.
Instrumentation & Tracing
Ensure every service propagates trace and correlation context (using W3C Trace Context or B3 headers) end-to-end, through HTTP, async jobs, and backend calls. Instrument each operation—registration, token issuance, API request—not just for timing but also for partner, organization, and scenario tags. Distributed tracing, with linked spans across gateway, auth, and backend, makes bottlenecks and failures visible before real partners are impacted.
Metrics: High-Cardinality and Real-Time
Expose not just basic request counts and error rates, but make metrics explorable by client ID, organization, endpoint, geographic region, and environment. Visualize registration patterns (DCR vs. Federation), spikes in onboarding errors, quota breaches, and slowdowns for specific partners using real-time dashboards. Comparative time-series analytics reveal trends, anomalous behaviors, or stealthy regressions before they break onboarding flows.
SLOs & Smoke Alerts
Define SLOs specific to partner onboarding—such as token issuance availability, registration completion latency, or end-to-end success rates for new orgs. Pair error budgets with synthetic monitoring and anomaly detectors that can trigger smoke alerts around onboarding failures, security issues (invalid certs or credential misuse), or authentication regressions, giving both teams and partners the confidence to launch and iterate quickly.
Structured Logs, Security, and Privacy
Log every registration attempt (including metadata, org/client IDs, IP/geography, and outcome), every token request, and every API result using structured, queryable JSON. Highlight anomalies like repeated onboarding failures, spikes in denied registration, or unexpected parameter use for real-time alerts and after-action forensics. Ensure sensitive fields are hashed or tokenized, and apply rigorous privacy and retention controls to observability pipelines so you meet compliance as you scale.
Developer/Test Observability
Integrate telemetry from your test harnesses, synthetic flows, and local CI into the same dashboards and traces as production. Instrument test failures and edge-case onboarding with traces and logs, allowing developers to debug and improve registration, token, and onboarding flows well before external partners hit any integration wall.
Observability as Code and Centralized Correlation
Make metrics, trace schemas, logging formats, and alerting rules part of your codebase and gated review process. Use feature flags to deepen telemetry coverage for high-touch partners or during onboarding ramps, and surface dashboards showing unified, cross-service partner journeys from registration through first live API call—tracing every anomaly, delay, or error to its source in a single pane of glass.
Beyond the Testing and Observability Basics: What to Add Before First Partner Onboarded
Implementing these capabilities ensures you’re not just observant, but proactive—identifying, reproducing, and resolving onboarding issues before partners even notice, and giving internal and external teams all the tools needed for rapid, confident integration.
Synthetic Partner Monitoring
Before any real partner attempts onboarding, deploy synthetic "canary" clients to emulate exactly what a partner would do—register, obtain tokens, and hit key API endpoints on a recurring schedule. These automated clients run in the same environments and follow the same authentication flows, surfacing issues such as certificate expiry, rate limiting, and endpoint misconfiguration well in advance. Ensure your canaries run across both sandbox and production, and propagate trace context so their journeys are reflected in your monitoring and alerting pipelines. Review latency, error, and feature coverage metrics from these canaries as part of operational health checks, especially before and after new deployments or infrastructure changes.
Chaos Testing
Go beyond standard failover by actively injecting faults: simulate expired partner certificates, mismatched signing keys, or invalid federation statements. Rotate keys on the fly and deliberately break trust chains; watch that the system fails predictably, denying access and generating actionable error logs and traces. Run chaos tests that purposefully overload rate limiters, force backend dependency failures, or bring down nodes in critical onboarding paths. Couple these with automated assertions to confirm your APIs and authorization systems degrade gracefully, and that incident alerts are promptly triggered for each injected fault.
Alerting Integration
Operate incident response at the speed of automation by connecting your SLO, error budget, and anomaly alerts directly to messaging tools like Slack or Teams, as well as your preferred incident management system. Structure alert payloads with detailed context (error type, impacted org/client IDs, trace links, recent deployments) so responders have actionable data without extra investigation. Carefully tune alert thresholds and implement deduplication to minimize alert fatigue, but always escalate critical onboarding errors or systemic authentication issues for immediate engineering review.
Partner Self-Diagnostics
Empower onboarding partners to troubleshoot integration snags independently by exposing detailed error messages, machine-readable diagnostics, and correlation IDs in every response. When a registration or token request fails, provide partners with exact validation error details, links to docs or sample payloads, and the full trace/request ID to accelerate their root cause analysis. Consider building a self-service “health check” or “diagnostics panel” that allows partners to verify connectivity, configuration, and credential health, reducing support overhead and increasing partner satisfaction.
Developer Checklist: Pre-Partner API Onboarding
- Automate happy-path and negative test scenarios for client registration, token issuance, and API flows
- Validate all API payloads against OpenAPI/Swagger contracts and compliance requirements
- Instrument every API layer (gateway, authorization server, backend, and test harnesses) with distributed tracing and correlation IDs
- Ensure logging is structured, searchable, and covers all onboarding, token, and API outcomes (including security-relevant events and org/client context)
- Track high-cardinality metrics: breakdowns by client, organization, endpoint, error type, and environment
- Set and monitor SLOs tied directly to onboarding, token latency, and organizational error budgets
- Integrate smoke alerts and notification channels with incident response tools and team chat
- Deploy synthetic canary clients for continuous monitoring of registration, authentication, and API call health
- Run regular chaos tests (cert expiry, key rotation, protocol edge cases, backend faults)
- Validate automated quota/rate limiting, throttling, and privacy/data retention flows
- Provide partners with clear diagnostic data—trace IDs, machine-readable errors, links to docs or payload samples—to support troubleshooting
- Centralize all observability (metrics, logs, traces, alerts) in dashboards, and version control your telemetry configuration for reproducible results
- Document all test cases, onboarding flows, error handling, audit, and partner self-service diagnostics
Takeaway: Ship Trust, Not Just Code - for Successful Partner Onboarding
Modern API onboarding isn’t only about passing tests—it’s about creating a system that proves itself every step of the way and tells you why when things go wrong. By combining deep functional testing, rigorous negative scenarios, real-time instrumentation, and proactive synthetic monitoring, you empower your platform to catch errors before partners do, surface root causes rapidly, and scale onboarding without losing sleep.
A well-prepared API ecosystem gives partners confidence to experiment, launch, and grow—with clear diagnostics and transparent signals that accelerate their builds and reduce your support load. Invest in these foundations before day one, and you’ll enable not just smooth onboarding, but resilient, transparent, and high-velocity partnerships for the future.
The best way to avoid sleepless nights is to validate your flows and see every request, error, and trace in real time. That’s how you transform onboarding from a gamble into a repeatable process. To take this from theory to execution, grab our guide Onboard Your First Partner in 30 Days—a hands-on playbook packed with configs and copy-ready code.
Practical Guide
Onboard Your First Partner in 30 Days - No Fluff, Just Code
Get the practical developer playbook with weekly steps, real configs, and copy-ready code to build, secure, and distribute your APIs fast.
Access Now →